

News & Insights
Stay updated on United Western’s latest news and insights. For more, follow UWG on LinkedIn.
United Western Supports Acquisition of 180 Innovations
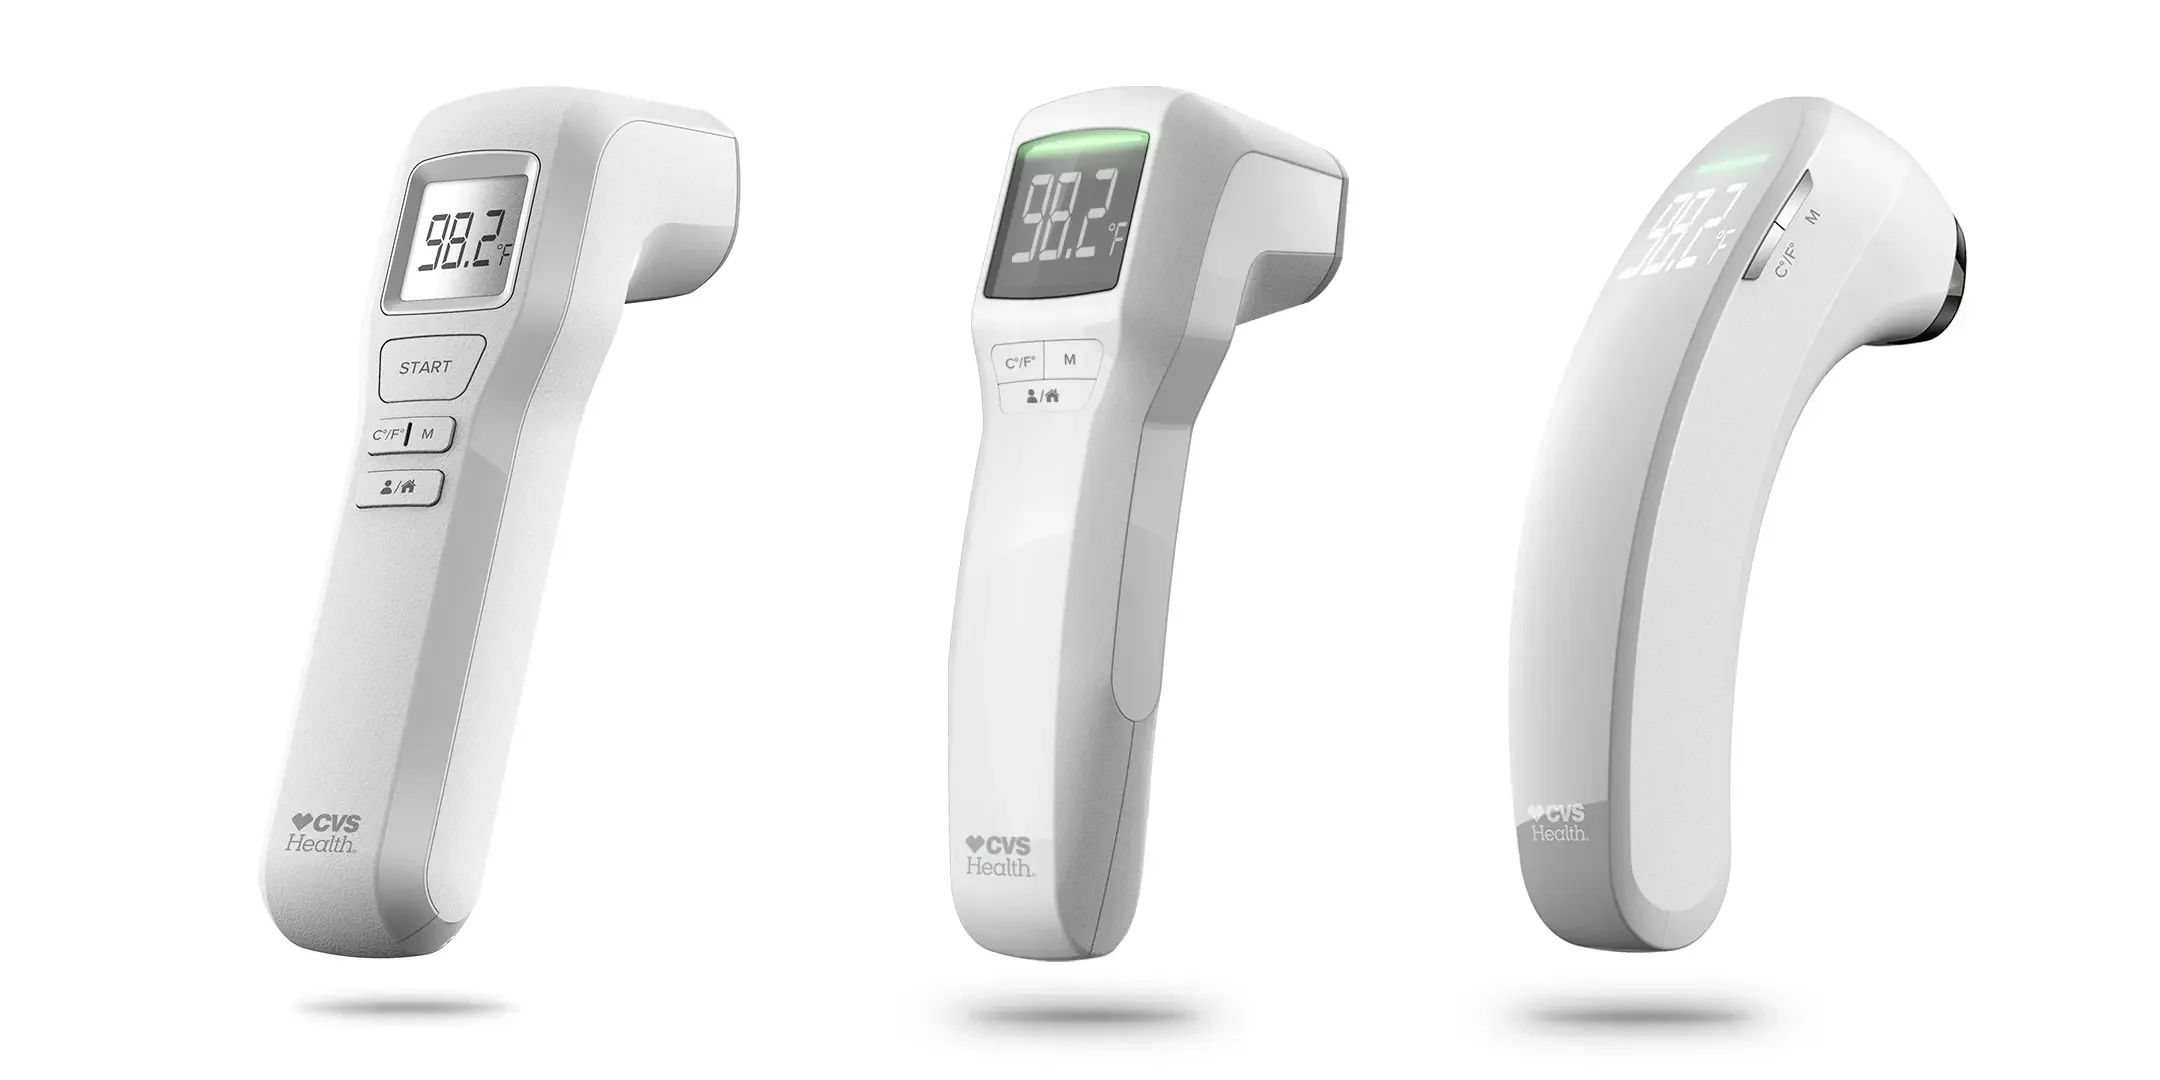
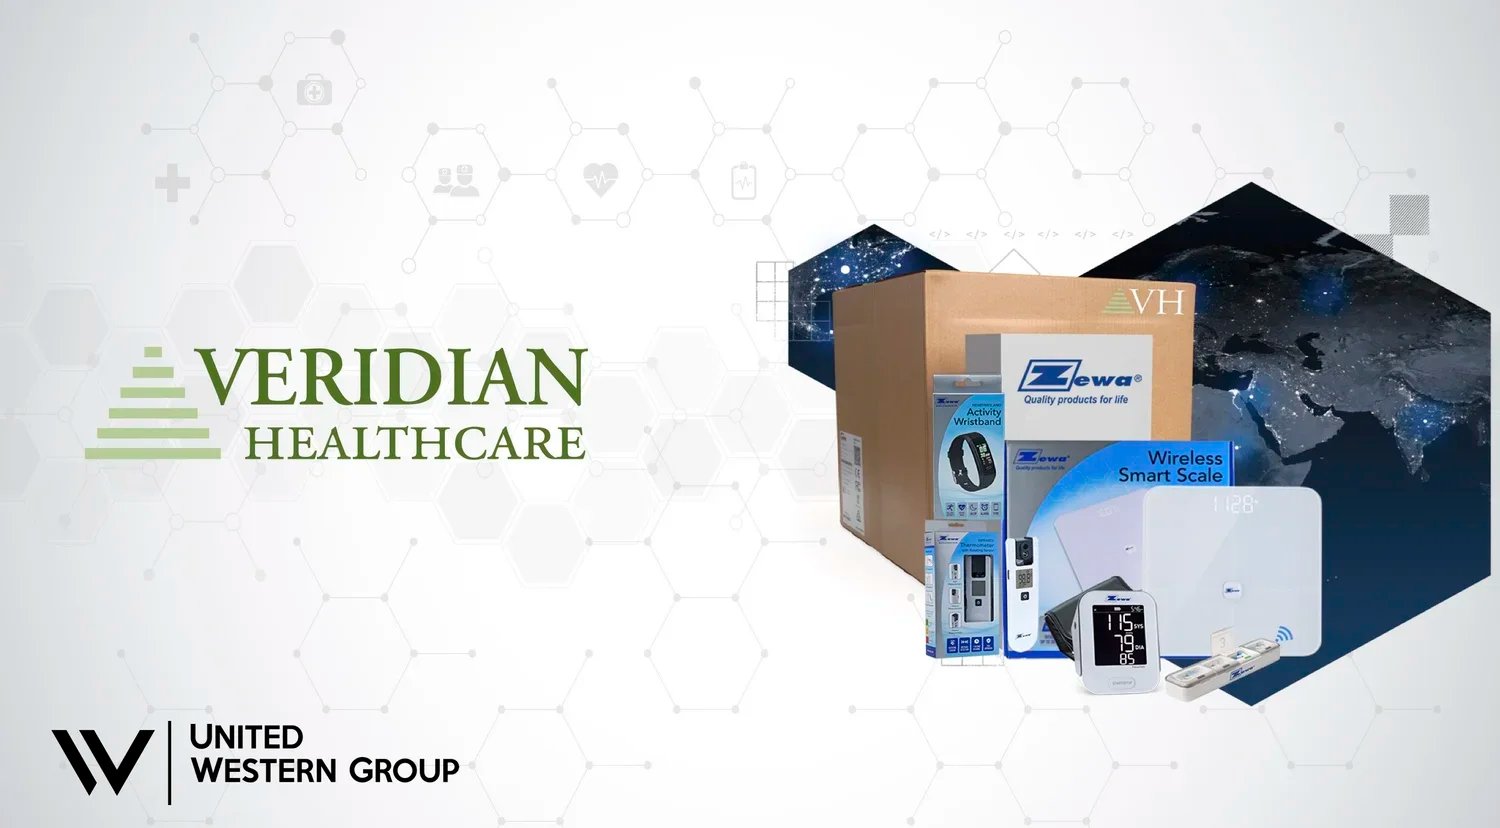
Veridian Healthcare, LLC is pleased to announce it has completed the acquisition of Zewa, Inc. Zewa is a leading supplier of a comprehensive suite of consumer retail, telehealth, and remote patient monitoring (RPM) devices.
United Western Group Named to Inc.'s List of Founder-Friendly Investors
Veridian Healthcare, LLC is pleased to announce it has completed the acquisition of Zewa, Inc. Zewa is a leading supplier of a comprehensive suite of consumer retail, telehealth, and remote patient monitoring (RPM) devices.
United Western Supports Aquisition of Zewa Medical Technologies
Veridian Healthcare, LLC is pleased to announce it has completed the acquisition of Zewa, Inc. Zewa is a leading supplier of a comprehensive suite of consumer retail, telehealth, and remote patient monitoring (RPM) devices.
United Western Group Acquires Veridian Healthcare
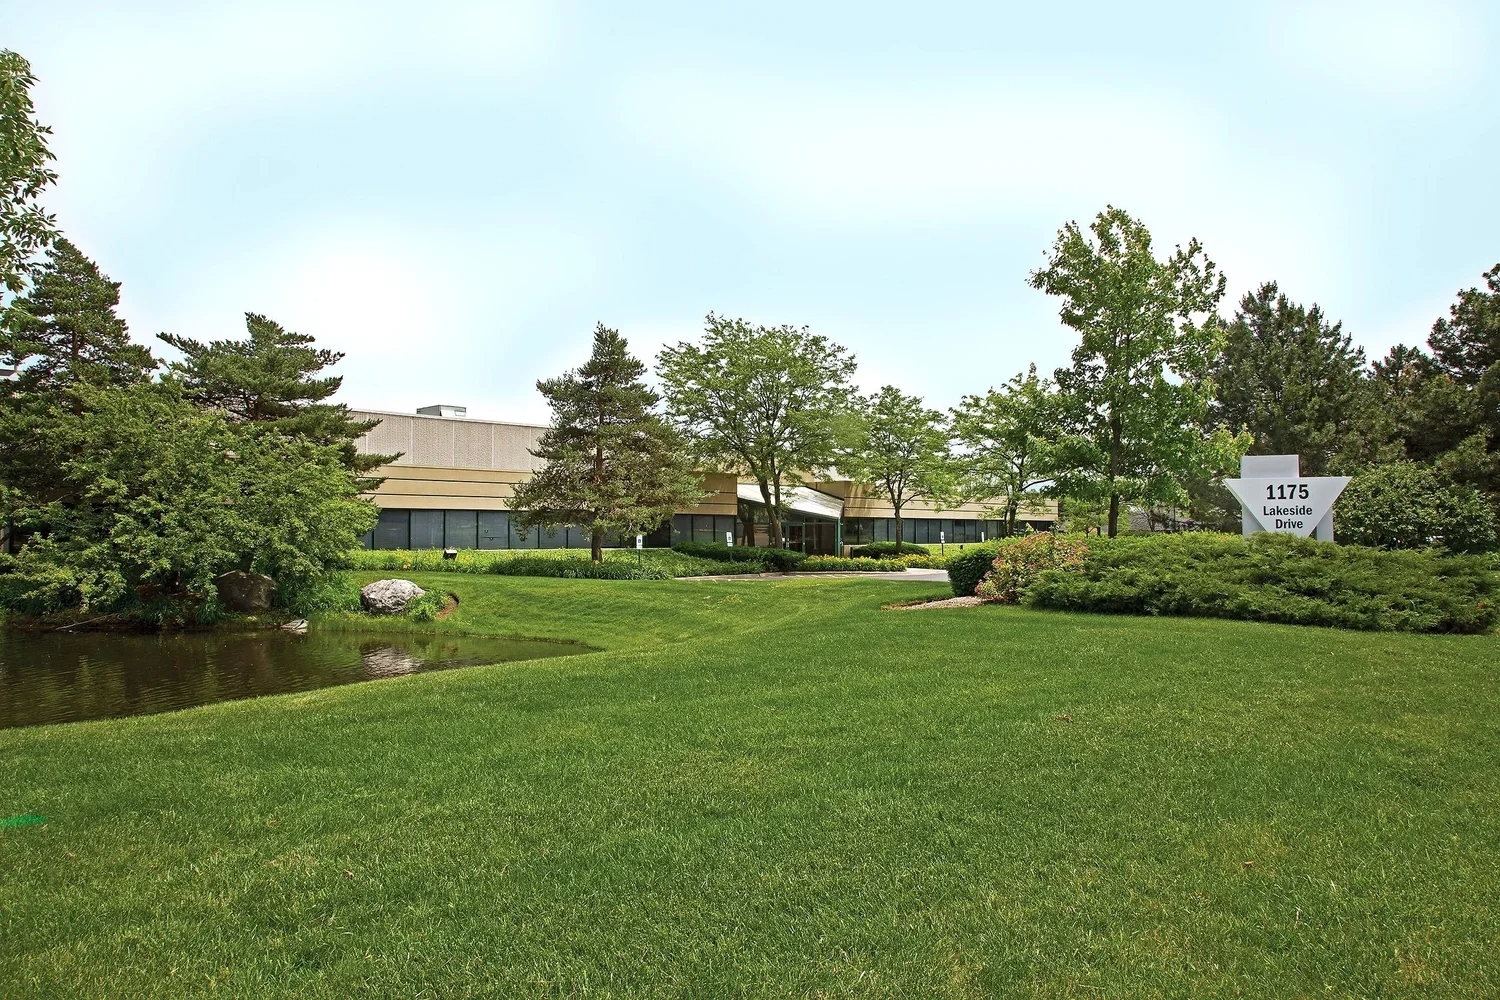
United Western Group is pleased to announce that it has partnered with HealthEdge Investment Partners, LLC and Advantage Capital Holdings, LLC to acquire Veridian Healthcare, LLC, a nationally recognized distributor of in-home diagnostics and pain relief products headquartered in Gurnee, Illinois.